Welcome to Worthy Reads, where I share some articles (and other things) that I think are worth your time. It’s always one of De Civ’s most popular features. It’s also the only one with any kind of paywall: everyone gets half the items, but only paid subscribers get them all. Retweets are not endorsements.
It’s election time! So let’s look at some of the most fascinating polls of the past little while!
Because of limitations on Substack, email, and my time, this edition of Worthy Reads includes a lot of detailed graphics without adequate text descriptions for blind and visual-impaired readers who are using assistive technologies. I apologize for the shortcomings. I have attempted to at least include links to the original sources, which are generally a bit more screenreader-friendly.
“Private Opinion in America,” by Populace Insights:
This is a poll that attempts to identify when people are lying to the pollster:
A majority of people say publicly that mask wearing was effective, but they don’t believe it in private.
Men [and independent voters] are not as supportive of abortion rights privately as they say publicly.
For people ages 30-44 [that is, school-aged parents], the vast majority (74%) privately think parents should have more influence over public school curricula, but only 48% are willing to say so publicly.
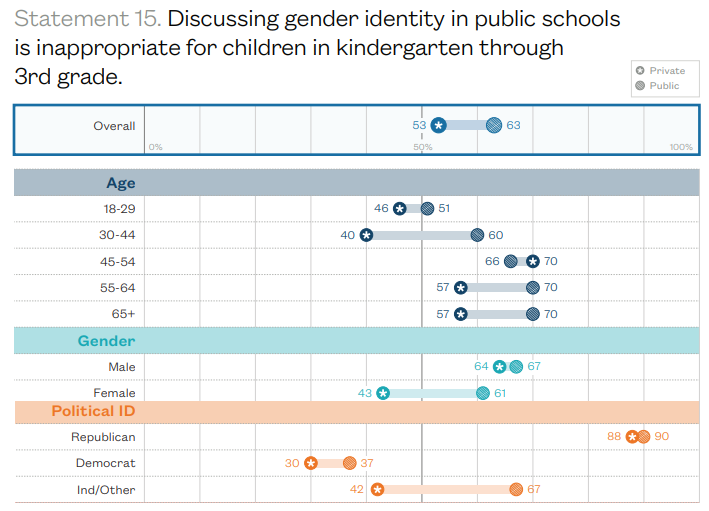
While a majority (60%) of these parents say discussing gender identity in public schools is inappropriate for young children (K-3), in private this is not the majority view (40%).
This poll used a clever polling method to figure out who lies to pollsters about different questions (nerd notes in the footnote1), leading to neat graphics like this:

As the project’s dedication quote says:
“Ten people who speak make more noise than ten thousand who are silent.”
—Napoleon Bonaparte
And it turns out that a lot of people are staying silent!
Several words of caution here:
This is a single poll, using a new methodology. The official “statistical” margin of error is 2%. However, the actual margin of error for polls is much larger, because statistical error is not the only source of error. There are errors in screening, in interpretation, and in weighting. The true margin of error in any given poll is generally double the “statistical” margin of error… and it’s usually wise to add an extra point on top of that, to be safe. (This is true of all polls. If a political poll says it has a +/-3% margin of error, treat it as a +/-7% margin of error instead. This “secret” margin of error is a huge factor in political forecasting and betting markets.)
So it seems you should treat the margin of error on this poll as 5%.
Moreover, because this poll was really running two polls and comparing the results—one for public opinions and one for private opinions (see the nerd notes in the footnote) (or free-listers can just read the poll’s methodology)—you should actually treat the margin of error on this poll as 10%. For this poll, if the difference between public and private opinion is less than 10%, there might not be a difference at all.
Even after taking all this into account, there are still outliers. Polls are designed to land within the margin of error 95% of the time. Sometimes, just because of freak bad luck, they miss. This poll asked 25 questions, twice each. That means we should expect approximately two of these answers—we can’t know which ones!—to be just dead wrong.
Finally, this poll spends a lot of time highlighting the “crosstabs.” Crosstabs are the results for subgroups, like “White people,” “Democrats,” and “people with less than $30,000 in annual household income.” Because of the way statistics work, crosstabs are inherently less trustworthy than the combined (or “topline”) results. I don’t know a good rule of thumb for this, and don’t think this poll tells us enough about its sample characteristics. Based on what I see, my gut says to discount any crosstab differences of less than about 15 points in this poll.
That was a lot of words of warning about overinterpreting a single poll, but I think it was worth the time, because these are useful things to know that will enhance your overall Polling Literacy! I follow polls almost religiously, and I believe polls, but it is critically important to understand their many, many limitations. Otherwise, they will mislead you, and you will be sad. (Compare SNL’s 2016 and my 2016.)
Even with all those grains of salt, this is still a fascinating poll to read through.
Some of the results are not at all surprising. For example, basically all demographic groups lie to pollsters about the effectiveness of masks. The biggest liars are independent voters, women, and poor people. All of these groups tell pollsters that masks work, but none of them collectively believes it. The people who aren’t lying so much are rich people (who believe masks work, and say so) and Republicans (who don’t believe masks work, and say so). This all tracks rather nicely with conventional wisdom.
On the other hand, I was very surprised to see that people are more supportive of teaching gender identity in public schools than they’re willing to admit in public! 63% tell pollsters it’s inappropriate… but only 53% actually believe that.
Who’s lying? Not Republicans: the GOP is both very strongly opposed to gender ID in the schools and entirely honest about it.
There may be some Democrats lying about it, where some of them say they oppose it but secretly are okay with it. This matches Republican stereotypes about Democrats as radicals who are pretending to believe in limits on their radical gender agenda while actually secretly supporting the most extreme outcomes… but the Democrats’ detected lying here is actually pretty small, and may not truly exist: 37% oppose K-3 gender identity lessons in public vs. 30% in private, only a 7% difference, and I just suggested a 15% margin of error for looking at crosstabs.
The real liars are apparently independents! They say they don’t want gender identity in K-3 (67%) but actually only a minority (42%) oppose it! Independents are huge liars on tons of questions in this poll (weirdly much), but, on this question, we see similar margins among women and school-aged parents (30-44 year olds). I dunno what’s going on here yet, but it’s good to know about it so we can investigate further.
This poll is full of interesting little treasures like this, even after taking it with all the appropriate grains of salt.
However, the most interesting phenomenon to me, and the real reason I wanted to talk about this poll, is how this poll reveals internal ideological pressures to adopt controversial views. When we think about lying to pollsters, we tend to think of people who are culturally marginalized (Black, female, poor, Republican, etc.) pretending to adopt views that are supported by mainstream cultural institutions and The Establishment.2 For example, The Establishment says that masks work, therefore people pretend they agree masks work, but actually they don’t. I’m calling this external ideological pressure, and there is some of that in this poll!
But there are also cases where certain identity groups are broadly identified with certain views. Members of those groups are internally pressured to pretend that they share their group views, even against the mainstream.
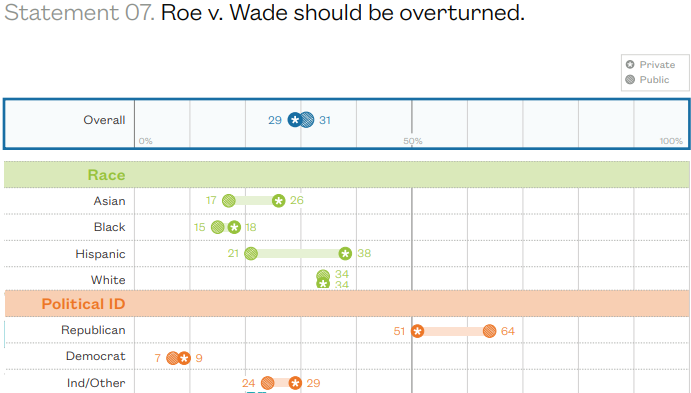
For example, the statement “Roe v. Wade should be overturned” was overall unpopular. (I’ve written before about why this isn’t a very useful question for abortion policy overall, but the ways people lie about this question are still directionally interesting.) Several demographic groups pretended to follow the mainstream view, but the data at least suggests that they were lying about it; Hispanics in particular were clearly concealing their anti-Roe views. This is bog-standard external ideological pressure: people will lie about views they have which are outside the mainstream. On the other hand, look how Republicans answered the same question:
Republicans publicly professed the overall unpopular view that Roe should be overturned. But the 13-point difference between what they said and what they actually believed suggests (although not QUITE at the bar I have arbitrarily set for statistical significance) that at least some Republicans are probably lying. But they’re lying to adopt an unpopular position! Why would they do that?
Well, as Republicans, they likely live in Republican communities, among other Republicans, and certainly are likely to associate with more right-leaning individuals no matter where they live. Their party is uniquely identified with wanting to overturn Roe, and that view is indeed popular within the party. So some Republicans are feeling ideological pressure, not from The Establishment, but from their own in-group! They’re falsely stating that they support the (unpopular) Republican view when, in reality, they support the (popular) Establishment view. They aren’t doing this to fit in with the mainstream; they’re doing this to fit in with other Republicans.
We see this in several other places throughout the survey. Black people, in particular, seem publicly more likely to take Left-leaning unpopular views while privately holding much more moderate opinions. But there’s a bit of this going on all over the place.
I think we don’t adequately appreciate the role this plays in polarization. It’s not just that we all feel sort of oppressed by The Establishment, but we are also (in some situations, not all!) roleplaying more extreme views than we actually hold in order to fit in with our particular factions.
I would love to see a poll like this that asks whether Joe Biden received more votes than Donald Trump in the 2020 election. Huge swaths of GOP voters say they think Donald Trump received more votes (NOTE: he didn’t), but I wonder how much of that is real support for a conspiracy theory and how much is partisan kayfabe.
I would equally love to see a poll like this that asks whether Democrats actually believe so-called fact-checks and misinformation notices, or just pretend to for dunks.
The FiveThirtyEight 2022 House Forecast, by Nate Silver and the FiveThirtyEight Team:

It’s no secret that Republicans are probably going to win the House of Representatives. I wrote a month ago that anything could happen, and I even affirmed that ten days ago, but the polls lurched heavily in the GOP’s direction last week. The Republicans have reversed their ill fortunes (for now?) and have recovered to the position they held in August. That movement seems to have stopped for now—Republicans are not gaining any more, at least not right now, and it could therefore reverse—but that’s where things stand at the moment. In four out of five possible futures, Republicans win the House in a couple weeks.
I want to talk about the possible future where they don’t.
People look at 19% and say “arrr, that’ll never happen.” This is a mistake. 19% chances happen about 19% of the time! Have you ever seen a baseball game where the home team is losing by two runs at the start of the 7th, but then they come back and win it? Of course you have. That’s an 18% chance.
Do you remember the 2020 election? The available data said that Joe Biden was probably going to walk away with it, and that Democrats were going to comfortably (maybe hugely) expand their delegation in the House of Representatives. Instead, the presidency was a nailbiter, and the Republicans gained over a dozen seats. On Election Day Eve, I rated the odds that they would do approximately that well or better at, guess what, 20%. FiveThirtyEight was even more pessimistic, rating a GOP gain of 14 seats or better as only 7% likely:
Democrats’ chances to hold the House here in 2022 are worse than Trump’s were in 2016:
…but the size of his win (304 electoral votes) was more convincing than even a Trump optimist would have expected:
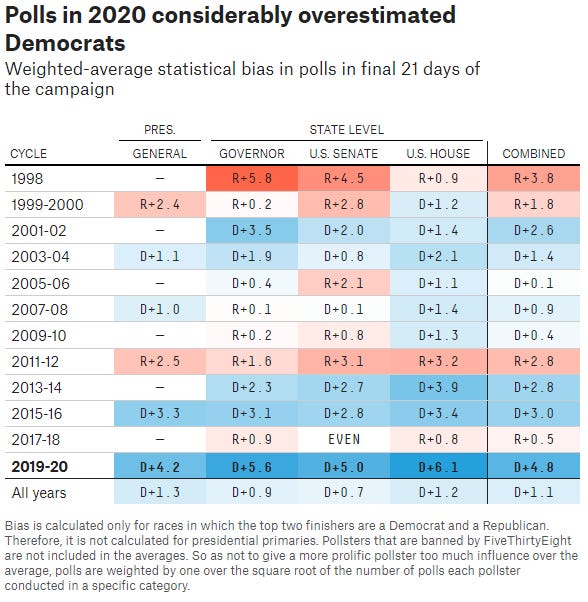
You might be sitting there saying to yourself, “yeah, but that’s just because all the Trump voters lied to pollsters! That won’t happen this year! Democrat voters don’t lie to pollsters!” We’ll talk more about that after the paywall, actually! (It’s not true, or at least the way people think about it isn’t true.) But, for now, it’s enough to point out that polling error goes all over the place:
The past few elections, polling error has inflated Democrats’ prospects much more than Republicans… but this could just be the result of random chance. Toss a red/blue coin four times in a row, and it’s not that surprising if it comes up blue three times (or red three times). After all, poll error went the opposite direction in 2012, and polling routinely gives Republicans false hope (sometimes by more than 2 points!) in Senate and Presidential races. There is some reason to believe that polls are systemically more likely to inflate Democrats’ numbers instead of Republicans’, but there is also not enough evidence to support that hypothesis just yet. Even if the hypothesis is true, polling error inflating Republicans will still happen occasionally, just more rarely.
In other words, the polls could be underestimating Democrats, just as much as they underestimated Republicans in 2020 or 2016. Here are some reasons to think that might be happening:
(1) Polls tend to miss new voters. Polling screens for “likely voters,” which usually means some combination of people who say they’re definitely gonna vote or who have voted in previous elections. Their contact lists are also often based off voter registration rolls, which doesn’t work for voters who only register just before Election Day (or on Election Day). So polls can miss big infusions of people who don't normally vote3 who decide that this is the election where they're gonna vote. This seems to have been one reason behind the Trump polling miss in 2016; Trump got a lot of lower-class people to the polls who had simply stayed home for Romney/Obama in 2012.
Who are the energized new voters coming off the sidelines in 2022? I’d like to say it’s Hispanic pro-lifers eager to stand up for the unborn now that they’re finally able to do so! But it’s probably just the opposite: disengaged white people, disproportionately women, who don’t normally vote but consider abortion rights an emergency situation, may have gone abruptly from “not even registered” to “definitely voting” during the weeks after Dobbs.
(2) Conventional wisdom is usually wrong. Everyone is now predicting a polling error against Republicans, which is exactly when you should raise your hackles and get nervous. Conventional wisdom, especially when it gets out ahead of the available data, is shockingly good at being exactly wrong.
In 2010, the conventional wisdom was that the extremely good polls for Republicans were overstating their position. In fact, they were slightly understating Republicans. In 2012, the conventional wisdom was that the polls showing Pres. Obama with a comfortable lead were overstating his lead, and that it would be a close race with Gov. Romney. In fact, the polls were understating Obama, who went on to a sweeping win. In 2016, conventional wisdom was that polls were overstating Trump’s chances; they weren’t. During the Brexit vote, conventional wisdom said that polls showing Leave within striking distance of Remain were overstating things, and that it wouldn’t even be a close vote. In fact, Leave didn’t just end up in “striking distance”; Leave won fairly convincingly. The history of election forecasting is littered with the charred corpses of pundits who jumped on a bandwagon off a cliff into a flaming pit of doom.
Why is the conventional wisdom so consistently wrong, then? Shouldn’t it only be wrong about half the time, by random chance? The theory is that conventional wisdom is so powerful that it actually pulls polling data and other data points toward the conventional wisdom, like gravity, making polls and other data more wrong than they would be normally. As a result, you can often (not nearly always, this is nothing close to a rule of thumb) make good money by (1) finding large gaps between forecast models and betting markets, where conventional wisdom has triumphed over the data, and (2) betting against the markets.
Betting markets today think Republicans are going to greatly outperform their polling. FiveThirtyEight rates the Senate a dead heat, with a tiny edge to Democrats. But PredictIt today gives Republicans a 70% chance at winning! That, in my mind, suggests that conventional wisdom has once again gotten out over its skis.
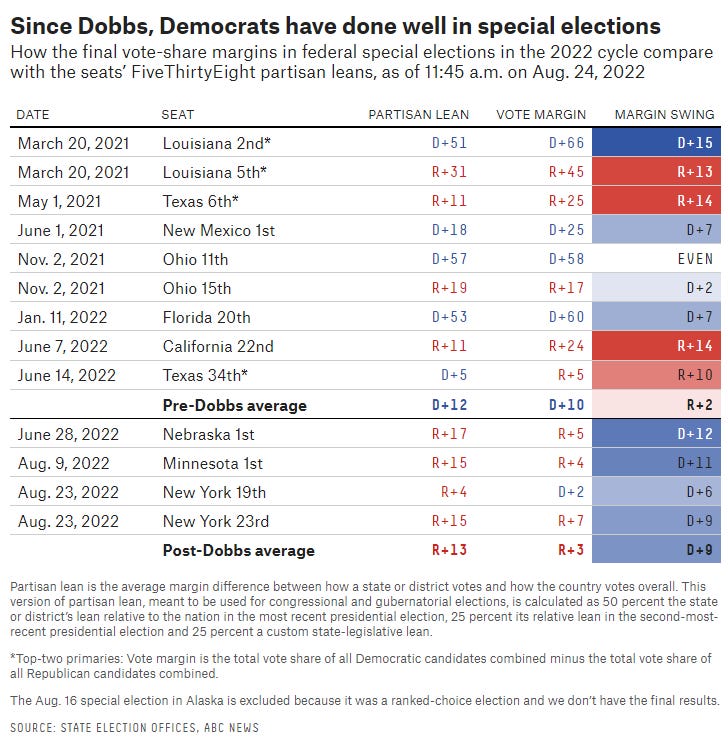
(3) Special elections since June have given solid evidentiary support to #1 and #2. The Kansas abortion vote was supposed to be at least close. Instead, it was a 20-point blowout for the pro-abortion side. This was repeated in a number of special elections for Congress. Between June and August, Democrats had four special elections and beat the district fundamentals all four times:
There are caveats on this. Late August was pretty nearly the doldrums for Republican prospects, and these districts are not broadly representative of America; they all have unusually high concentrations of Whites (and, proportionately, White progressives). And, hey, it’s only four elections! Dems also had a four-in-a-row run of beating expectations in June 2021 - January 2022, and nobody thought it meant “Roevember” was happening, just that the flipped coin came up blue a few times in a row. (Meanwhile, Glenn Youngkin and Jack Ciattarelli beat the polls in the opposite directions in November 2021.) Special elections are, historically, not nearly as predictive as other measures, like the generic ballot… which is why the FiveThirtyEight forecast (correctly) gives Democrats a 19% chance, not an 82% chance!
But if we do wake up on November 9th and we find that the Democrats have held the House and perhaps expanded their Senate delegation—an unlikely but real possibility!—this is probably how it will have happened.
This is where the paywall hits. Sorry, free subscribers, you are all beautiful people, but De Civitate’s paying subscribers deserve some reward, at least occasionally. If you’d like to sign up to support my work and, incidentally, read the rest of this edition of Worthy Links, you can do so here:
In the remainder of this edition of Worthy Links: identifying the people who aren’t responding to polls, a caution on Hispanic realignment, and a bonus video.
Keep reading with a 7-day free trial
Subscribe to De Civitate to keep reading this post and get 7 days of free access to the full post archives.


