Who Wins? A 2012 Projection Based on the Partisan Skew Hypothesis
In my recent (and surprisingly popular) post about the weirdly good polls the Democrats have been seeing recently, I suggested that the polls might be suffering from an unidentified systemic source of bias. I promised a followup discussing the implications of systemic polling bias on the presidential race. Since we are now only three days away from Election Day, I've decided to go whole hog and write up my final projections for the race at the same time.
But first, polling bias and its effects. You might be asking yourself, "Why is James putting himself out on a limb endorsing this fringe electoral theory a week before the elections? Why not just sit back and wait for the fallout?" Frankly, it's because I want the credit if I'm right. I think the theory has merit, and I am looking forward to seeing the glory that will accrue to me on Wednesday morning. (If I'm proved wrong, then you will forget. This is the magic of punditry. Win-win for me.) In fact, the falsifiability of this thesis is one of its most exciting aspects.
So suppose I am right. The polls are biased; the Democratic turnout advantage is smaller than projected. Does Romney win? Well, that depends on how large the bias is, and I can't even begin to hazard a reasonably useful guess about that. Normally, I would check the polls, but the polls are precisely the problem here. Some have pointed at Gallup's recent voter ID surveys as evidence that Republicans will achieve turnout parity in 2012 -- but Gallup's polls are already showing much better results for Romney than the polling consensus, which suggests that their model is simply better attuned to Republican voters, fully explaining their voter ID results. We have no way of determining whether their model is superior to the others on the market, and, indeed, we should assume that it is wrong, because it is a dissenter. We really are just guessing.
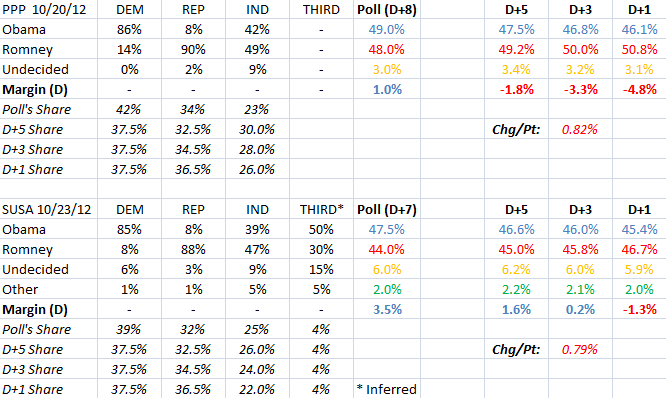
But before we try to hazard a guess, let's look at the big picture of polling bias. A few days ago, I grabbed two polls from Ohio virtually at random. I checked their crosstabs to obtain their results by party, then rescaled the polls to show how the poll would have likely turned out if there had been different numbers of Republicans and Democrats in the sample. Here is the snazzy chart:

You'll notice the "inferred" results from the SurveyUSA poll. The partisan ID categories SUSA provided were "Republican", "Democrat", and "Independent", but the totals added up to only 96%, and (just using those 96%) the final poll results I calculated were off from SUSA's published results by about a point. I concluded that SUSA had excluded self-identified third-party voters from their partisan ID results, and I did some math to figure out roughly what their 4% had contributed to the final poll results. (Which makes me, I don't know, Yoda?) Hopefully, I done right.
I deliberately used polls that showed both bad and good results for Mr. Romney. At the time the chart was made, the FiveThirtyEight average showed Ohio at Obama+2.3 (it is now Obama+2.9). You'll notice that the PPP poll is a bit lower than that (Obama+1), while the SUSA poll is a bit higher than that (Obama+3.5).
However, both polls show the same strong partisan ID in favor of the Democrats, and D+8 and D+7, respectively. Ohio's official partisan turnout in 2008, the Democratic wave election, was D+8. (In reality, it was likely closer to D+5.) In 2010, the Republican wave year, it was R+1. My hypothesis is that these partisan ID's are several points more Democratic than reality will reflect on Tuesday. For instance, if all we do is rescale these polls so that they show the 2008 D+5 result, rather than their current vast partisan margins, both polls tighten up significantly: SUSA's 3- or 4-point race becomes a 1- or 2-point race. PPP's 1-point lead for Obama suddenly flips to a 1-point lead for Romney.
And that's assuming the Democrats do about as well in crushing Republican turnout as they did in 2008! Further adjustments to account for theoretical "missing Republicans" only shift the polls more in Romney's favor. These changes are very steady, which allows us to calculate a rule: every extra percentage point voter ID for Republicans translates to a 0.8% change in the race.
I should emphasize now that I looked at only two polls, which means this post should be considered strictly unscientific. My reviews of other recent polls strongly suggests that my findings would be generalizable, but I can't swear to it. I've proved nothing, and that's even if you assume my fringe theory is correct to begin with. All I have done is set the stage for my personal 2012 election projections. (However, there is this really nifty blog, which I came across while writing this post. They are reaching similar conclusions, but doing a ton more data processing than I am. Check it out!)
So, now that we have quantified the effect of statistical polling bias, we have to ask ourselves what will be the magnitude of the bias on election day? How many voters will the Democrats and Republicans actually turn out? Normally, we would ask the polls. Instead, I just have to guess.
There's really no hiding that. It's a guess. I can educate myself as much as I can. I can look at the best available numbers on this year's enthusiasm gap. I've got the Washington Post's cool story on Obama's defectors. I can grab Pew's 2008 voter ID findings. And then I can notice that their voter ID numbers are clearly wrong (they suggest a popular vote margin of +7.5 for President Obama; the reality was +6), and rebalance their D+7 sample to reflect, with some confidence, the actual partisan ID gap in 2008 (I end up with D+5). I can even look to my own scant research into swing state partisan changes during 2008-2012.
But, in the end, it's still a guess. To me, it appears that the President will probably not meet his 2008 turnout numbers, even with early voting plumping him up. That sets his ceiling at D+5. At the same time, this has none of the hallmarks of the 2010 Republican wave, where the margin was about D+0 (or D+1). Everything about the race so far suggests that the parties are about evenly matched. So let's split the difference and predict that this race will end up at a partisan ID of about D+3.
If I am correct (and remember I am just guessing, which makes this more witchcraft than science), then the polls will be off by a significant margin. They have been showing an average partisan bias of about D+8, according to my recent findings. My D+3 guess would make their partisan shares about five points off. As we discussed above, every point of change in partisan share is worth about 0.8 points in the final margin.
We can now calculate the expected bias (the difference between the final polls and the actual returns) in this race: 0.8% * 5 = +4% Obama. In other words, I believe the polls are inflating President Obama's margin by about 4 points.
Right now, based on current polls, FiveThirtyEight projects the final popular vote at 50.6% Obama, 48.4% Romney (+2.2 Obama). Based on my guess about the true partisan ID in this race, I project an actual result of 48.6% Obama, 50.4% Romney (+1.8 Romney). If I am correct, then this is a very close race, but Mr. Romney will win it about 3 times out of 4.
My projected battleground state margins:
Colorado: Romney+2.5 Florida: Romney+4.4 Iowa: Romney+0.9 Nevada: Romney+0.1 New Hampshire: Romney+0.7 North Carolina: Romney+6.5 Ohio: Romney+1.1 Pennsylvania: Obama+1.4 Virginia: Romney+2.8 Wisconsin: Obama+1.1
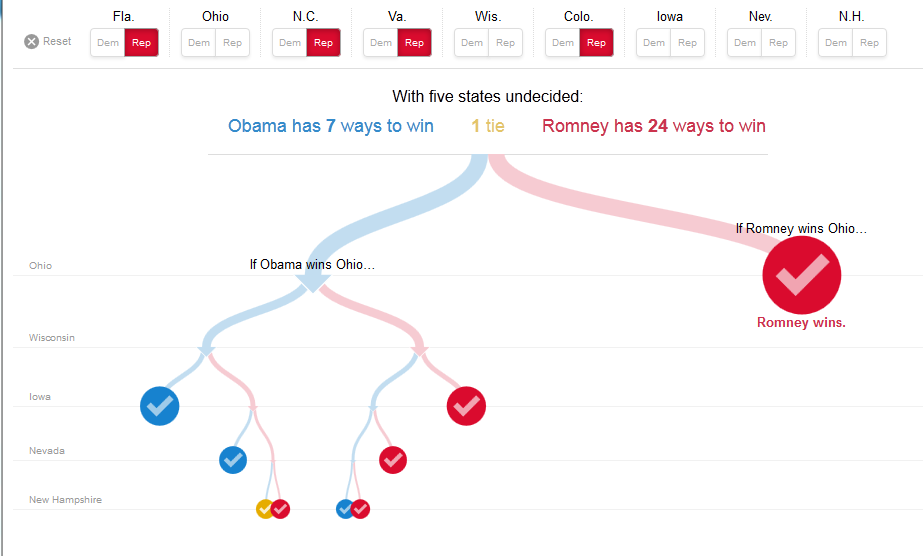
This is not quite as strong for Romney as it looks... but it is not bad. It leaves him quite a lot of paths to victory, and very few for the president:

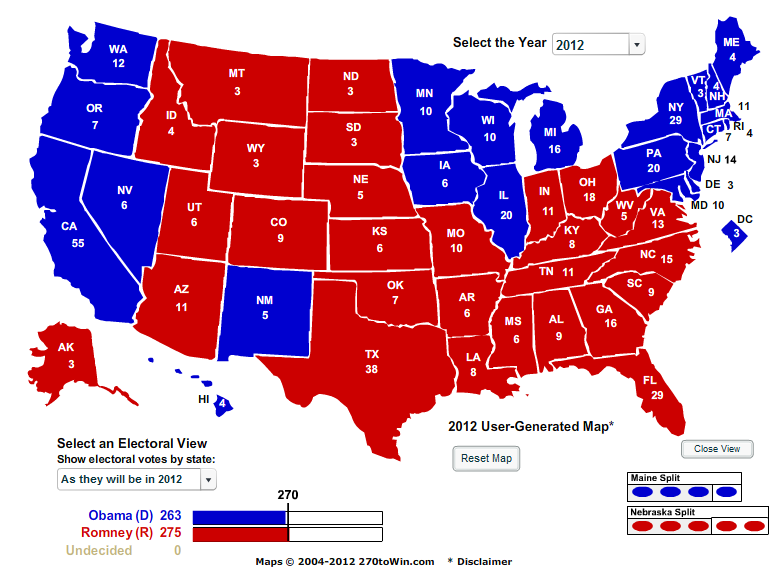
Finally, even though it's stupid to project a literal electoral map (they are too fuzzy!), I can't resist making the attempt. The beauty of it is, I win either way: I predicted back in March that Romney could not win the electoral college. So now I'm predicting that he can, and here's how he does it:

However, please bear in mind that, even if I am right about everything, this is still a very close race. Even if you accept all my theories and guesses as accurate, President Obama still has a very good chance of picking up an Iowa or an Ohio and ruining the electoral math for Mr. Romney.
Of course, if I'm not right about everything, it will be a very short night.
And don't underrate that possibility. There is a very sizable chance that I am dead wrong. For all we know, the polls could be biased against the Democrats and they're about to sail to a blowout win! Because of the great uncertainty about my predictions, the tenuousness of Romney's lead even in my projection, and the historical strength of polling, I am still going into election night with a realistic belief that President Obama is 60-75% likely to be re-elected. Mitt Romney remains the underdog.
On the bright side, we should know relatively early whether I was right or the polls were.
P.S. It would be really interesting to find out what effect my predicted polling bias could have on the Senate races. But there aren't enough stolen hours in the world for me to do that write-up before the election.
P.P.S. I predicted Gore in '00 and Kerry in '04, but Obama in '08 and the Republican wave in '10. One way or another, his election will be the tiebreaker! (Well, I also predicted Dole in '96, but, to be fair, I was 7.)


