The Great Democratic Turnout Miracle
During this cycle, likely voter polls have consistently shown more Democrats showing up to vote than Republicans.
Actually, that is a bit of an understatement. It is perfectly normal for Democrats to outnumber Republicans, even at the polls, even in strong Republican years (like 1984 and 2010). Historically speaking, an equal number of Democrats and Republicans showed up to vote in the presidential election of 2004. Independents sided with the Democrats that year, but the Republicans made up for it with especially strong turnout in battleground states. In 2010, the Republicans and Democrats were again equal, but it became a wave election because independents sided with Republicans. 2008, by contrast, was the perfect storm for Republicans. Democrats had the largest turnout margin in history (+7% versus Republicans) and overwhelmingly won independent voters to deliver a huge electoral territory to Sen. Barack Obama. So predicting that the Democrats will have a turnout advantage in the election is like predicting that Pennsylvania will go blue: once the flirting's over, the answer is always yes.
What's weird during this cycle is that likely voter polls have consistently shown Democratic turnout crushing Republicans by a margin that augur not only the end of the Romney candidacy but possibly the Republican party itself.
Take Ohio, which is likely to be the state that decides this election. Nate Silver's 538 model, which I swear by, currently rates Ohio as +2.3 Obama, +/- 5.7. That margin of error gives Romney a 1-in-4 chance to win Ohio and, likely, the election. But let's break this down a little bit.
In the historic Democratic wave of 2008, the CNN exit poll of Ohio showed a partisan breakdown of 39% Democrats, 31% Republicans, 30% Independents (or D+8). In reality, this was probably more like 37.5% Democrats, 32.5% Republicans, 30% Independents (D+5), and I'll defer to the linked post to explain why. Let's compare this vast partisan ID advantage -- the product of huge Democratic voter enthusiasm against a disenchanted Republican base -- to today's polling.
Here is a table showing FiveThirtyEight's eight most recent, highly-weighted polls that provide partisan breakdowns:
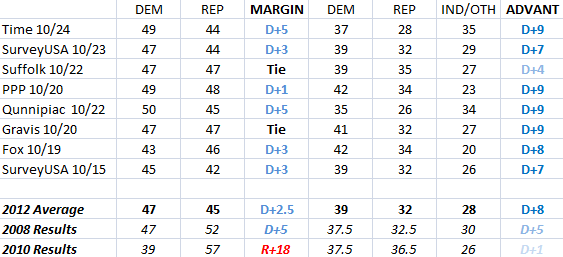
In other words, the Ohio polls are showing President Obama not just meeting his historic benchmarks from 2008, but actually exceeding them -- by a huge margin. This effect is replicated in other swing states, like Colorado and Nevada. This means that, even though Mitt Romney leads among independents by high-single-digit margins, this Democratic turnout miracle is able to utterly overwhelm everyone else at the polls and bring home the win for the president. It's like the 2004 Republican victory on steroids.
What could possibly account for such an extraordinary boost in likely Democratic turnout this year? Nobody seriously believes that Democrats are as excited to vote for four more years this year than they were to support "hope and change" last time around. Everyone can see on their own streets and college campuses that Obamamania is a trifle cooler. It is still a very strong political machine, but it is not the phenomenon it was in 2008. Likewise, no one seriously believes that the Republicans are as depressed as they were in 2008. They're not close to their 2004 ecstasies, but they're ready to fire this president. The conventional wisdom is that this election will be a lot less one-sided than the last one. Perhaps conventional wisdom is simply, dramatically, wrong: Democrats are more enthusiastic to vote this year than ever, and Republicans hate Mitt Romney so much they'd rather punish their party with four more years of Obama. But that seems unlikely.
Among my liberal friends, there's a much stronger hypothesis circulating: Democratic party ID has grown, not because Democratic turnout is better, but because Independents are turning into Democrats, and identifying themselves as such on the phone. This fits the "war on women" narrative OFA has been peddling all year, and, on days when Todd Akin or Donald Trump or Mitt Romney says something stupid, it's plenty believable.
But, when we dig into the evidence, there's not much support for it. The polls themselves are a bit of a cipher, but we need to look outside the polls for our evidence, since what we're questioning are the polls themselves. In other words, we need hard numbers. The perfect tool for the job: statewide party registration statistics. Unfortunately, Ohio doesn't have partisan registration. I instead looked at two similarly-situated swing states that do: Colorado (538 Obama+0.7) and Nevada (538 Obama+2.9). Thanks to both states' Secretary of State offices for making it easy to compile these statistics.
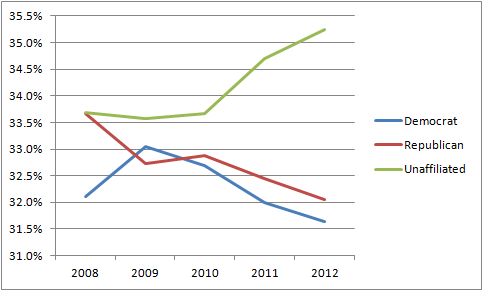
If the "independents are becoming Democrats" theory is correct, we should see two things in these charts: (1) a smaller share of independents, and (2) a larger share of registered Democrats. One of my liberal friends suggested that maybe Republicans are becoming independents at the same time, so what we would see is actually (1) a smaller share of Republicans and (2) a larger share of Democrats, while anything could happen with the independents. Fine. Either way, we should see substantially more Democrats since 2008. Do we?
No.
Colorado
Nevada
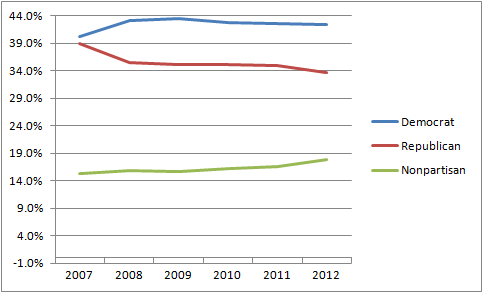
In reality, it looks like, in both states, people are staging something of an exodus from both of the two major parties. In both states, the Democrats have lost about 1.3% of their share since their 2008/2009 peak. Independents have gained about 2%. Republicans are losing share, too, at about the same pace as the Democrats. This is broadly consistent with national polling, and that's always nice. At first glance, it looks like the "independent conversion" theory doesn't apply. The reverse is in evidence: Democrats are leaving the party and becoming Independents -- a group that supports Romney by a wide margin!
Still, simply looking at overall state registration probably is a little too blunt. In states that have these statistics, they're gathered from a voter's registration card... and are very often not updated until the voter has to re-register (whether because he has moved or because he has gone inactive). So these statistics don't necessarily tell us much about what's going on today. More likely, they're telling us something about the party ID in their state about a decade ago. For example, in Nevada, about 5% of voters are registered members of the "Independent American Party," a defunct third party that existed only between 2001 and 2004.
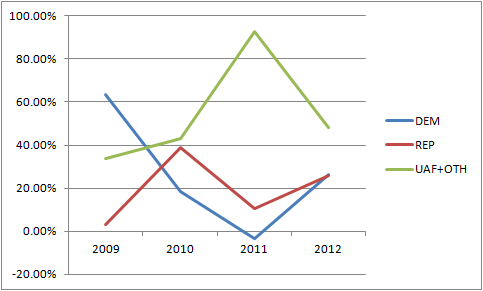
To find out what's happening in each political party today, we can look instead at each party's share of new registrations in each year. We look at how many people each party added in a given year, then compare that number to the other parties to get a percentage. This tells us what's happening right now in each party -- not what happened ten years ago. It will serve as a useful, back-of-the-envelope proxy for both partisan affiliation and partisan enthusiasm. We are, once again, looking for higher activity in the Democratic party, and lower activity in the other two parties, compared to 2008/2009:
Colorado
Nevada
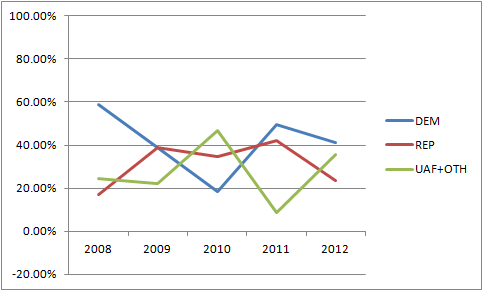
Once again, we come up short. If the "independent conversion" hypothesis were accurate, we would be seeing the blue line sitting way above the other two lines, especially in the 2010-2012 window. That would indicate that the Democrats are indeed recruiting more new voters, faster than their opposition. But the Democrats are obviously not achieving that. Their opponents are doing better at recruitment, in many cases, and, even when the Democrats hold a recruitment lead, it is a narrow lead.
The evidence suggests that the Democratic party is no larger than it was in 2008, relatively speaking, is probably smaller, faces resurgent competition, especially from independent voters who left the party in 2010, and, to top it all off, is suffering from diminished enthusiasm compared to 2008. It is still a very strong party, certainly the strongest party in U.S. politics. But it is not a party that has made any substantial inroads into other parties since its historic wave election in 2008. The "independents are becoming Democrats" theory, then, while very appealing in Obama campaign ads, does not appear to hold water.
So, if it's not raw recruitment, and it's not high turnout, then what is driving the astonishing Democratic voter machine the polls are showing? I only have one theory left, and I don't like it one bit.
I suspect there is an undetected, systemic sampling problem with this year's polling. I believe the polls are consistently picking up an incorrect partisan sample, which creates the illusion of record-breaking Democratic D+9 domination when, in reality, the Democrats' efforts this year will be more like an echo of 2008 than an expansion upon it. I predict that the polls will prove wrong on Election Night.
Now, let me explain why it is incredibly unlikely that I am right. I'm not accusing any single poll of being an outlier, or of using a particularly bad methodology, or of having a partisan house effect. That kind of thing happens all the time, outliers are just part of life in polling, and the 538 model goes to considerable lengths to mitigate and correct these everyday flukes in individual polls. I, by contrast, am suggesting that nearly every poll is wrong, regardless of their methodologies, regardless of house effects, regardless of anything else that can affect the day-to-day success of any single pollster. I am suggesting that they are all getting the same error, and that this error just happens to be the one on which the entire election turns.
This is the kind of thing crazy people believe. It's also something desperate partisans believe when their man begins losing in the polls. How keenly I remember the HuffPo comment threads of 2010 complaining about Republican "oversampling" in the pre-election polls! In reality, they turned out to be a little bit undersampled for the impending Republican wave. This year has given us UnskewedPolls.com, where some GOP wannabe spends his days denouncing his competitors as "effeminate" and arbitrarily adjusting all polls to have R+2 samples.
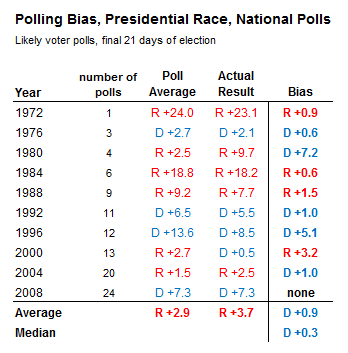
However, it is not without precedent. Even taken collectively, are never quite perfect, but there have been a number of years when they have been off by substantial margins. Here is a table from FiveThirtyEight -- note the large divergences in 1980, 1996, and 2000:
For myself, all I can say in my defense is that I have been seeing this for well over a month, during both the good weeks for Romney and the bad, and I have the Facebook status updates to prove it. Today just happens to be the first time I've had the opportunity to write about it.
Now, notice what I'm not saying: I'm not saying that there is some kind of media conspiracy to disadvantage Republicans this cycle. I have no doubt that all our polling companies are working in good faith to get the best possible results. After all, their livelihoods depend on it. I do not think pollsters should be weighting their samples by partisan ID, because that's putting the cart before the horse; their job is to find out what the partisan ID is, so they can't assume beforehand that they already know. They are all just calling houses, and the people who pick up are a lot more likely to be Democrats than Republicans. Is this some kind of bizarre cell-phone responsiveness effect? Is there a new liberal Bradley Effect? Is it an unexpected result of the fact that pollsters are having a much harder time getting voters to pick up the phone this cycle than last? (Poll response rates are down from 25% to 10%.) Are Republicans continuing their 2011 tradition of trolling pollsters? Is this an artifact of early polling? Are Republicans simply less interested in picking up the phone this year for some reason?
I don't know. I don't actually consider any of those possibilities very likely. I just think they are, overall, more likely than an actual D+9 partisan gap in this year's election, given the two pieces of evidence we've already discussed: (1) observation shows that Democratic enthusiasm is lower, and Republican enthusiasm higher, than they were in 2008, and (2) hard voter registration statistics show no evidence of big Democratic gains by conversion of independents.
In other words, I think the Great Democratic Turnout Miracle is going to turn out to be a myth. Tomorrow, I'll discuss the electoral implications if the partisan breakdown is just a little bit different than it is today. Hint: it's good for Mr. Romney, but by no means guarantees him the election.
CORRECTION: The table of recent Ohio polls, when originally posted, was in error. In two polls (the Time 10/24 and the Suffolk 10/22), people who had already voted (taking advantage of Ohio's early voting laws) were inadvertently excluded from our summary results. Further, the Time poll bore the wrong date (it was published 10/24). Oddly, these corrections appear to strengthen our thesis, if anything. Embarrassing, yes, but that is what I get for trying to throw together a whole blog post during my lunch break at work! I, of course, regret the error. The original graphic, with the incorrect data, is here.


